How well do you know your users? Recently, I decided we didn’t know ours well enough. I set off to find out more about the people behind our product, and in the process, attempted to answer some (very basic) business questions. The classic tool for browsing the user base is the CRM. But its strict schema made data exploration a chore. I needed simplicity, flexibility, and automation: adjectives that are rarely used to describe a CRM. I found the solution to be Google’s coolest feature that you aren’t using.
The Plan
Here’s some questions I started with:
- Who are our biggest users?
- What’s the average company size of a paying user?
- What features best seperate free plan users vs pro plan users?
- Who should be paying money but isn’t?
What are some dimensions that we care about? Email, Company, Job Title, Active/Churned Status, Subscription Plan, Monthly Recurring Revenue.
Cool, looks like my CRM has all of these things already.
What about: who’s paying money and using our iOS SDK?
Ok .. we’ll need to add Languages to each account.
Another Dimension
"Another dimension, another dimension
another dimension, another dimension."
   -- Beastie Boys - Intergalactic
If you’re as lucky as me, you have yourself a sparkling brand new Salesforce account. Salesforce is a CRM database with strict schema, meaning LastName is absolutely required on a Lead object. And if you even think about using a blank string, your request will be denied (unless you have the Enterprise Edition, of course).
Every object (like Lead, Contact, or Account) comes with a bunch of standard stuff, like FirstName, LastName, and Company. But we want to know whether a new account is using the iOS library, or the Java library. That means we need to add a custom field called Library to our Salesforce Account object, so that we can build ourselves a stylish Office Space style report.

Take a sip of your coffee, put away your Leap to Conclusions mat because adding data to your Salesforce objects is a doosey. Just to give you a quick rundown of your new life:
- Simply navigate to
Setup > Build > Customize > Account > Fields. - Create a new
Libraries__cfield. - Add code to add the
Library__cfield to all new Accounts, and confirm that it looks okay in Salesforce. - Write a migration for the old projects to import libraries.
- Build a report to capture all iOS substrings
And what if the data doesn’t turn out to be interesting? Well, you’ll just have to remove that field and start again.
The Shackles
Maintaining strict schema while iterating on your data model is setting yourself up for failure. You’ve chosen the format before knowing what you’re trying to learn! It’s like typing backspace on a typewriter, instead of prototyping with silly putty. Every change will involve lots of your developer’s time wrestling to get the data into the tool, and into the proper format. And soon, every change will bring more frustration than value.
"It's Like Shearing a Pig:
Lots of Squealing but Little Fleece."
   -- President Vladimir Putin, on Edward Snowden
When you’re first exploring the data, you don’t even know if the questions you’re asking are right, let alone whether the answer will be interesting. Just like in any analytics work, you need to design lots of experiments.
At Growth Hacking Conference 2013, Facebook engineers said that one of the most important factors in growing a platform is decreasing the time between experiments.
After going through this schema process multiple times, I realized that it was too painful. I needed more flexibility in my column choices, and I needed to be able to set hundreds of cells quickly. I needed to move faster.
The Past
Long before the first Salesforce rep cold-called someone at 8am, there existed a thing known as a spreadsheet. In these spreadsheets, people would be able to create and hide columns, copy around hundreds of values in seconds, and filter tens of thousands of rows using substring matches. You’d be able to search the entire spreadsheet using a simple find dialog, and even make graphs in seconds.
When I learned of these spreadsheets, they immediately drew my interest. But I had so many questions: where can I get one? Do I need to enter all my data by hand? How can it be updated? Can I share it with my co-workers? What if two people are editing it at the same time?
When I googled the word “spreadsheet”, the answer surprised me.
Google Spreadsheets
Google Spreadsheets are an already-existing interface for editing, filtering, and analyzing free-form data (psst, you don’t have to build it). It’s backed up in the cloud. It’s sharable between any amount of people. Any edit is propogated to all viewers in real-time, and any formulas are immediately updated. And it’s free.
Who are our biggest accounts?
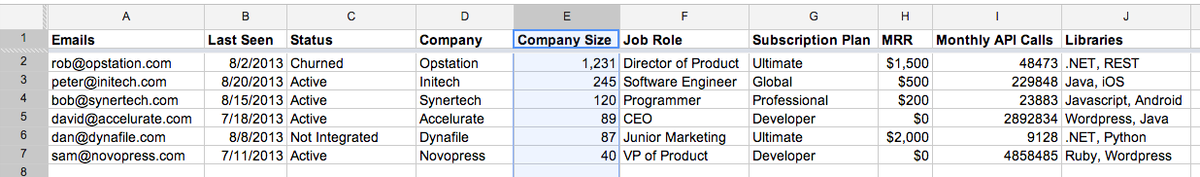 Sort by the company size column
Who is most engaged?
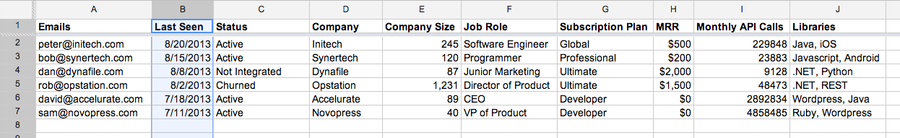 Sort by the last seen column
Who is paying the most?
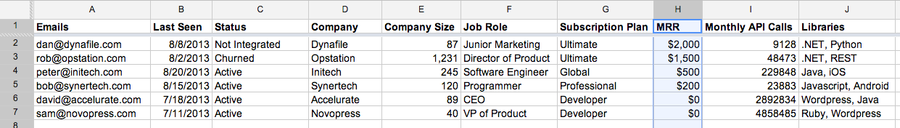 Sort by MRR
Who should be paying?
 Filter by $0, and sort by the company size column
Who are the biggest accounts that churned?
 Filter by churned
Who are our biggest mobile users?
 Filter by { "Android", "iOS" }, and sort by company size
Not only can you get the total amount in each category, but you can see account names, emails, and the actual people behind the stats.
So seriously, why aren’t you using Google Spreadsheets?
Carpal Tunnel

A very valid reason to move away from spreadsheets is manual data entry.
If you have a few high touch accounts, then its not really a problem. But when you have tens of thousands of users and accounts, data entry can be kind of a bummer.
Luckily, Google is here to save us again.
Google App Script
Google App Script is a computing platform that consumes Google App services, and runs on the Google Cloud. In layman’s terms, you can write code that downloads information from your database, and then allow you to write that data into a spreadsheeet. For free. And as many times as you want.
If you’re not excited yet, here are some killers features of Google App Script:
Make HTTP Calls
You can make GET / POST HTTP calls to your own server, or to any other servers.
var response = UrlFetchApp.fetch('https://admin.company.com/users?secret=abc');
var json = JSON.parse(response);
The most obvious use case of consuming your own admin servers to get information out of your database. Or you can do clever stuff like query customer’s sites to see whether your javascript is still on there, or read their meta tags to see what their business does.
Manipulate Cells
You can manipulate any spreadsheets, documents, or presentations that you have access to.
sheet.getRange(2,1).setValue('tom@initech.com');Email Graphs
Or dynamically generate graphs, and then send them to any amount of people in your company.
  var dataTable = Charts.newDataTable()
        .addColumn(Charts.ColumnType.STRING, "Quarter")
        .addColumn(Charts.ColumnType.NUMBER, "Income")
        .addColumn(Charts.ColumnType.NUMBER, "Expenses")
        .addRow(["Q1", 50, 60])
        .addRow(["Q2", 60, 55])
        .addRow(["Q3", 70, 60])
        .addRow(["Q4", 100, 50])
        .build();

  var chart = Charts.newColumnChart()
    .setDataTable(dataTable)
    .setColors(["green", "red"])
    .setDimensions(600, 400)
    .setXAxisTitle("Quarters")
    .setYAxisTitle("$")
    .setTitle("Income and Expenses per Quarter")
    .build();


MailApp.sendEmail(
    "me@company.com", // Recipient
    "Income Chart",  // Subject
    "Here's the latest income chart", // Content
    {attachments: chart });
Trigger Scripts
Google App Script will let you run scripts as frequently as once a minute, or whenever someone updates the spreadsheet. It’s crazy!
Use Libraries
In May 2012, Google introduced Google App Libraries which bring something like a package manager to your Google App projects. If you thought that App Script development was previously unbearable, you can now forget that now. You can now include indispensable javascript libraries, like Underscore, Moment.js, or your own libraries.
A New “CRM”
At Segment.io, we now have auto-updating spreadsheets of all of our users, our projects, and our accounts. And it’s not just the total number of users, its the actual people behind the numbers. When we need to add another piece of information, we just add a column. We’re actually iterating quickly, and learning about our users!
Every week, we get emails with the customers that are using each analytics service, sorted by the most integrated. Largest accounts using Omniture? Check “Omniture by Usage”. We get emails with all the customers who haven’t yet integrated, but are big companies. Want to find all the accounts using mobile, sorted by most API calls? Check yesterday’s email for “iOS by Usage”.
The other day a new team member told me about some really active accounts that I had no idea existed. He didn’t touch a database, didn’t ask a developer, just went to Google Docs. If this is the kind of simplicity that’s appealing to you, try adding Google App Script and spreadsheets to your arsenal.